.png)
What Is Anomaly Detection in Business Analytics?
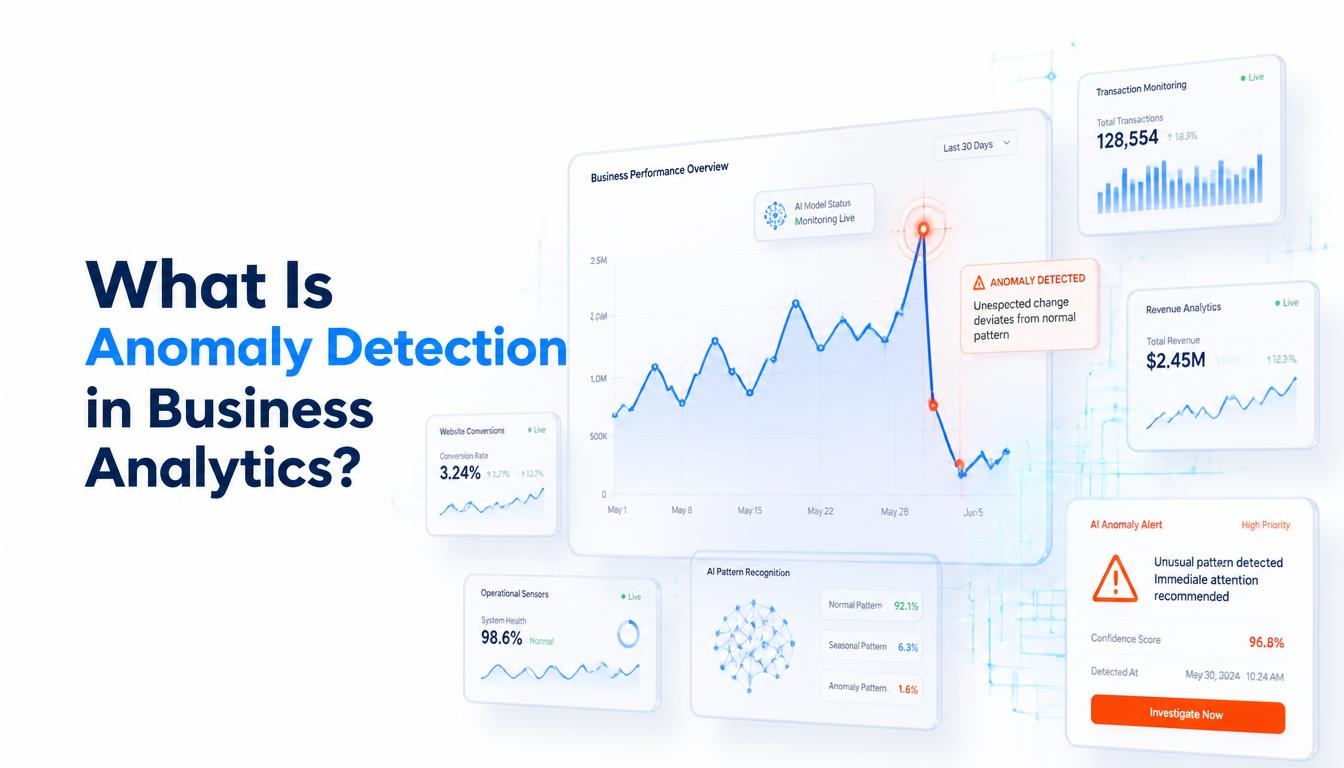
Every business generates a constant stream of numbers: orders, payments, page views, sensor readings, support tickets. Most of the time those numbers behave predictably. Then one morning a payment total jumps, a warehouse scanner goes quiet, or conversions fall off a cliff, and nobody notices until the monthly report. So, what is anomaly detection, and why are more analytics teams building it into their daily workflow?
In short, anomaly detection is how you catch the unexpected while it still matters. This guide explains the concept in plain language, walks through the main types and techniques, shows where it delivers value across industries, and helps you evaluate the right tools for your team.
What Is Anomaly Detection? A Plain English Definition
Anomaly detection is the process of identifying data points, events or patterns that deviate significantly from what is normal or expected. In business analytics, it means automatically flagging unusual behavior in metrics such as revenue, transactions, website traffic, inventory levels or system performance, so a person can investigate. You will also see it called outlier detection, though the two terms are not always identical (more on that in the FAQ below).
An anomaly is not automatically a problem. A sudden spike in sales might be a pricing error, or it might be a campaign that went viral. The value of anomaly detection is that it surfaces surprises early, so you can decide which ones are threats and which are opportunities.
Consider a retailer that normally sells around 200 units of a product per day. If sales suddenly hit 2,000, the cause could be a mispriced listing, automated bot purchases or a viral social post. Without monitoring, the team may find out at month end. With anomaly detection, an alert can arrive within minutes.
Types of Anomalies in Business Data
Not every unusual pattern looks the same. Understanding the three main types helps you choose the right detection method and set sensible alerts.
Point anomalies
A point anomaly is a single data point far outside the usual range. A $50,000 card payment on an account that typically spends $80 at a time is a classic example. These are the easiest anomalies to spot and the most common starting point for fraud monitoring.
Contextual anomalies
A contextual anomaly is a value that is normal in one situation but unusual in another. Five thousand website visitors at 2 pm on a sale day is expected, but the same traffic at 3 am on a quiet Tuesday deserves a closer look. Time, location and season all provide context.
Collective anomalies
A collective anomaly is a group of data points that are abnormal together, even if each one looks fine on its own. A series of small transfers, each just under a reporting threshold, is a well known example. Detecting these requires looking at sequences and relationships, not isolated values.
How Anomaly Detection Works
Whatever the method, the workflow is similar: the system learns a baseline of normal behavior from historical data, scores new data against that baseline, flags large deviations and sends an alert. The differences lie in how the baseline is built.
Statistical methods
Techniques such as z scores, moving averages and seasonal decomposition measure how far a value sits from an expected range. They are simple, transparent and work well for stable, single metrics. They tend to struggle when data has many interacting variables or shifting patterns.
Machine learning methods
Algorithms such as isolation forests, clustering and one class support vector machines learn the shape of normal data and flag whatever does not fit. Many are unsupervised, meaning they do not need labeled examples of past anomalies, which is helpful because true anomalies are rare. When you do have labeled cases, such as confirmed fraud, supervised models can be trained to recognize them.
Deep learning methods
Autoencoders and recurrent neural networks can model complex, high dimensional and sequential data, such as sensor streams or long time series. They can catch subtle patterns other methods miss, but they need more data, more tuning and offer less explainability.
Approach | Best for | Strength | Limitation |
Statistical | Stable, single metrics | Simple and easy to explain | Misses complex patterns |
Machine learning | Many variables, no labels | Adapts to changing data | Needs tuning and clean data |
Deep learning | Sequences, high-volume streams | Finds subtle patterns | Data hungry, harder to explain |
Why AI Anomaly Detection Matters for Business
Traditional monitoring relies on fixed rules, such as "alert me if sales drop by 20%." Rules like this break down quickly. They ignore seasonality, promotions and growth, so they either fire constantly or miss real problems. This is why AI anomaly detection business teams adopt tends to focus on learning the baseline automatically and updating it as conditions change.
The practical benefits are easy to see:
• Faster detection: issues surface in near real time instead of at the next reporting cycle.
• Fewer false alarms: models account for trends and seasonality, so alerts are more relevant.
• Scale: one system can watch thousands of metrics that no analyst could review manually.
• Faster diagnosis: many tools point to the segment, region or product driving the change.
AI is not a substitute for judgment, though. It tells you that something changed, not always why. Human review remains essential, and models are only as reliable as the data feeding them.
Business Use Cases Across Industries
Anomaly detection shows up wherever data is generated continuously and unexpected changes carry a cost. Common applications include:
Industry | Example anomaly | Business impact |
Finance and banking | Unusual transaction size, location or frequency | Earlier fraud and compliance alerts |
Retail and e commerce | Sudden drop in checkout completions or a pricing error | Protects revenue and customer experience |
Manufacturing | Abnormal vibration or temperature readings | Predictive maintenance and less downtime |
IT and operations | Traffic spikes or slow response times | Faster incident response |
Marketing analytics | Unexpected click or conversion swings | Catches tracking errors and ad fraud |
Want to go deeper on one of these? See our guide to [Internal link: time series anomaly detection → cluster post URL] or explore [Internal link: fraud detection with machine learning → cluster post URL].
How to Choose Anomaly Detection Software
Options range from built in features in BI platforms to dedicated monitoring products and open source libraries. Before comparing vendors, be clear about which metrics matter most and who will act on the alerts. Then evaluate anomaly detection software against practical criteria.
What to look for
• Data connectivity: native connections to your warehouse, databases and business apps.
• Seasonality and trend handling: the tool should understand weekly, monthly and holiday patterns.
• Explainable alerts: clear reasons and contributing factors, not just a score.
• Adjustable sensitivity: the ability to tune thresholds and mute known events.
• Alert routing: integration with email, Slack or ticketing tools your team already uses.
• Security and governance: access controls and audit trails that fit your compliance needs.
Common challenges to plan for
• Poor data quality: missing or delayed data creates false anomalies.
• Alert fatigue: too many low value alerts train people to ignore all of them.
• Few labeled examples: real anomalies are rare, so favor unsupervised or semi supervised approaches.
• Changing baselines: what counts as normal shifts over time, so review and retrain models regularly.
A sensible way to start is a small pilot on one high value metric, such as daily revenue or payment failures. Measure how many alerts were useful, tune the settings, and expand from there.
Frequently Asked Questions
What is anomaly detection in simple terms?
Anomaly detection is the process of automatically finding data points or patterns that differ sharply from what is normal. In business analytics, it flags unusual changes in metrics such as sales, transactions or website traffic so teams can investigate quickly.
What is the difference between anomaly detection and outlier detection?
The terms are often used interchangeably. Outlier detection usually refers to finding extreme values in a static dataset, while anomaly detection is broader and also covers unusual patterns that depend on context or timing, such as a normal sales figure on the wrong day.
What are the main anomaly detection techniques?
The three main families are statistical methods (such as z scores and moving averages), machine learning methods (such as isolation forests and clustering) and deep learning methods (such as autoencoders). The right choice depends on data volume, complexity and how explainable the alerts need to be.
How does AI improve anomaly detection for business teams?
AI learns what normal looks like from historical data, including trends and seasonality, and adjusts as the business changes. This reduces false alarms compared with fixed thresholds and lets teams monitor thousands of metrics at once.
How much data do I need to start with anomaly detection?
You need enough history to capture your normal cycles, such as weekly patterns and seasonal peaks. Data quality matters more than volume: clean, consistently recorded metrics will outperform a large but messy dataset.
Is anomaly detection software only for large companies?
No. Many BI and analytics tools now include built in anomaly detection, and smaller teams can start by monitoring a single high value metric, such as daily revenue or payment failures, before expanding.
Conclusion
Anomaly detection turns raw business data into an early warning system. By learning what normal looks like and flagging what does not, it helps teams catch fraud, errors, outages and hidden opportunities before they show up in a quarterly review. Start with one important metric, choose software that fits your data and your team, and refine as you go.
Ready to put your data to work? [CTA: Explore our analytics services / Contact us → link] and see how monitoring can help your business.