.png)


Step one
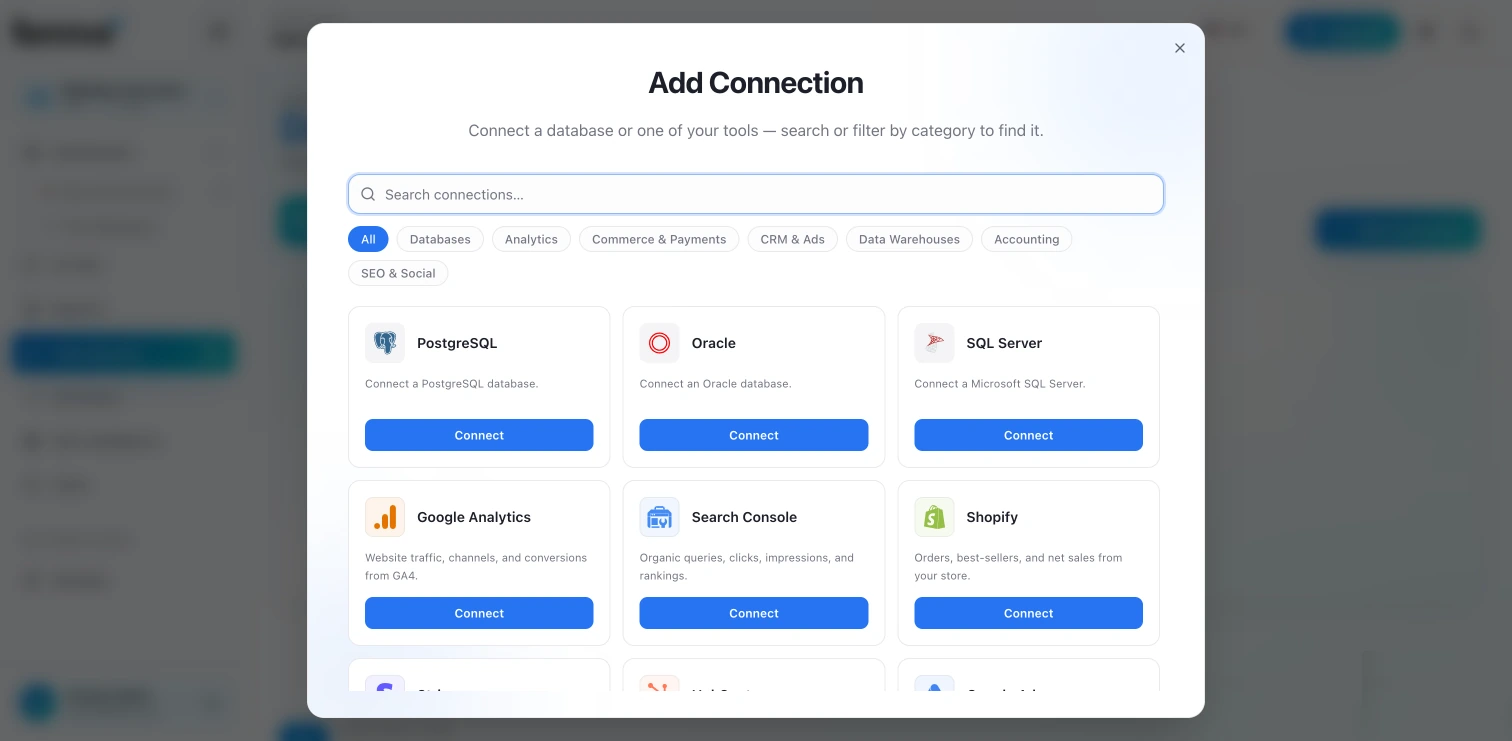
Add a connection
Search the catalogue or filter by category: databases, analytics, commerce and payments, CRM and ads, warehouses, accounting, SEO and social. Fill in the fields and connect.
Clear answers, not more dashboards.
Fennix connects your business data with market trends, competitor activity, SEO intelligence and social sentiment, so you see the whole picture and know what to do next.
30 days free, no credit card
16 connectors, live in days, every answer traceable to its source
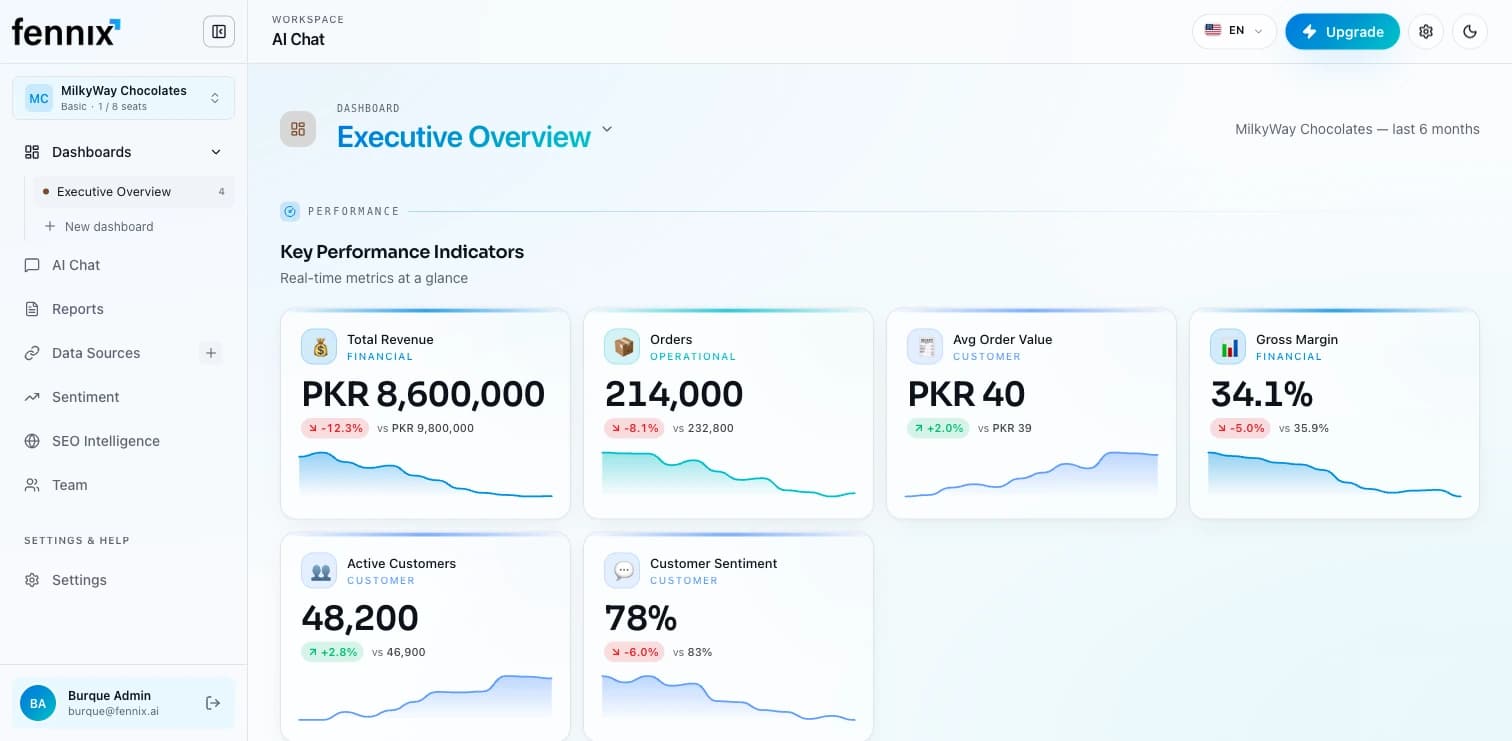
The Fennix Executive Overview dashboard with revenue, orders, average order value, margin, active customers and sentiment
Watch a question in plain language turn into a governed answer with the chart that backs it up.
By bringing fragmented information into one intelligent layer, Fennix helps leaders uncover insights, understand the reasons behind performance changes, identify risks and opportunities, and determine the next best steps.
Databases, warehouses and documents, connected once and queried in plain language.
Where your category is heading, not only where your own numbers landed.
What rivals are shipping, ranking for and spending on.
Keyword gaps, traffic shifts and demand signals that move ahead of revenue.
How customers feel about your brand, tracked across every connected channel.
The pattern nobody had time to look for, surfaced the moment it appears in your data.
Not just that revenue moved, but which region, product and channel moved it.
Risks and opportunities ranked, with the next best action spelled out.
What ships on day one
connectors, from Postgres to Shopify to Ahrefs
chart types, drag and drop, no analyst needed
export formats: PDF, Excel, Word, PowerPoint, link
day free pilot on your own data
Databases, ad platforms, storefronts, finance and SEO tools. Connect a source and Fennix starts answering questions about it.
Your first source takes minutes, not a project plan
These are real screens from the Fennix app, in the order you meet them.
Step one
Search the catalogue or filter by category: databases, analytics, commerce and payments, CRM and ads, warehouses, accounting, SEO and social. Fill in the fields and connect.
Step two
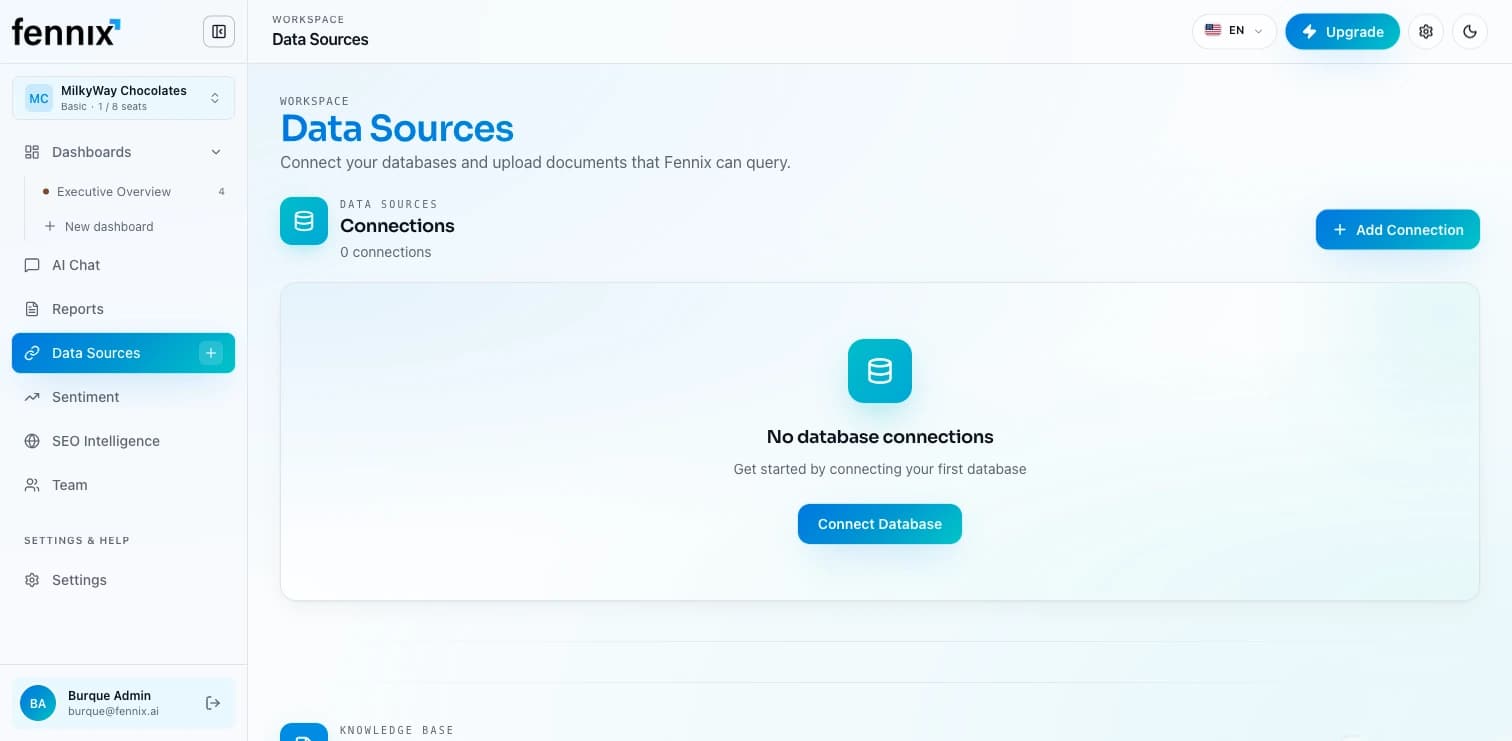
Every connection and uploaded document sits in one place, ready to be queried. Add the next source whenever you like.
Step three
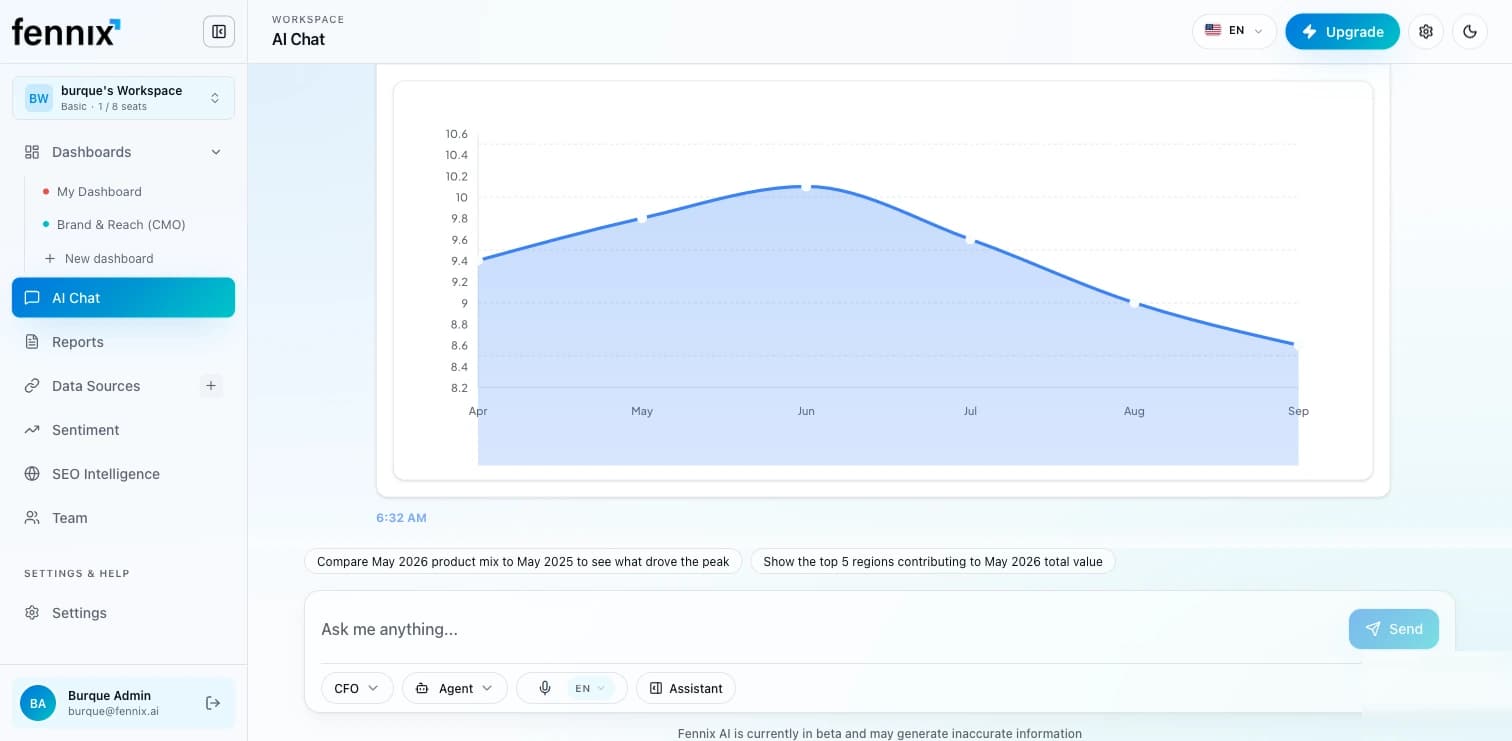
No SQL, and no dashboard to build first. Ask the question you would ask an analyst and Fennix answers with the chart behind it.
Step four
Turn answers into a live dashboard your team watches every morning, with the KPIs and the movement against last period.
These are real screens from the Fennix app, in the order you meet them.
Step one
Search the catalogue or filter by category: databases, analytics, commerce and payments, CRM and ads, warehouses, accounting, SEO and social. Fill in the fields and connect.
Step two
Every connection and uploaded document sits in one place, ready to be queried. Add the next source whenever you like.
Step three
No SQL, and no dashboard to build first. Ask the question you would ask an analyst and Fennix answers with the chart behind it.
Step four
Turn answers into a live dashboard your team watches every morning, with the KPIs and the movement against last period.
Ask anything and get a governed answer with the reasoning and the source data behind it.
no SQL needed
Build the board view yourself, 19 chart types, drag and drop, always current.
ready in minutes
Anomaly alerts and forecasts that reach you long before the monthly report does.
before it costs you
Pick a slot that suits you. We will go through Fennix on your stack, your questions and your numbers.
Start free, decide faster.
Connect a source, ask your first question, and see what your data has been trying to tell you.
no credit card required